
La Crosse, Washington
La Crosse | |
|---|---|
 Photo of La Crosse taken from the south | |
 Location of La Crosse, Washington | |
| Coordinates: 46°48′51″N 117°52′48″W / 46.81417°N 117.88000°W | |
| Country | United States |
| State | Washington |
| County | Whitman |
| Incorporated | February 19, 1917 |
| Government | |
| • Mayor | Randy Camp |
| Area | |
| • Total | 0.85 sq mi (2.21 km2) |
| • Land | 0.85 sq mi (2.21 km2) |
| • Water | 0.00 sq mi (0.00 km2) |
| Elevation | 1,480 ft (451 m) |
| Population | |
| • Total | 297 |
| • Estimate (2022)[4] | 294 |
| • Density | 373.54/sq mi (144.14/km2) |
| Time zone | UTC–8 (Pacific (PST)) |
| • Summer (DST) | UTC–7 (PDT) |
| ZIP codes | 99136, 99143 |
| Area code | 509 |
| FIPS code | 53-36850 |
| GNIS feature ID | 1506035[2] |
| Sales tax | 7.9%[5] |
| Website | lacrossewa.us |
La Crosse is a rural small town in Whitman County, Washington, United States. The population was 297 at the 2020 census.[3]
History[edit]
With the completion in 1888 of the Oregon Railroad and Navigation Company (O.R. & N) railroad line between Riparia and La Crosse, George Dawson and his wife built a shack constructed from railroad ties. By 1889, La Crosse had a population of 12. The first real store was constructed in 1899 by Tom Shobe.
La Crosse was incorporated on February 19, 1917.
Geography[edit]
La Crosse is located at 46°48′51″N 117°52′48″W / 46.81417°N 117.88000°W (46.814289, -117.880097).[6]
According to the United States Census Bureau, the town has a total area of 0.78 square miles (2.02 km2), all of it land.[7]
Climate[edit]
According to the Köppen Climate Classification system, La Crosse has a warm-summer Mediterranean climate, abbreviated "Csb" on climate maps.
| Climate data for La Crosse, Washington (1991–2020 normals, extremes 1901–2021) | |||||||||||||
|---|---|---|---|---|---|---|---|---|---|---|---|---|---|
| Month | Jan | Feb | Mar | Apr | May | Jun | Jul | Aug | Sep | Oct | Nov | Dec | Year |
| Record high °F (°C) | 64 (18) |
70 (21) |
80 (27) |
95 (35) |
100 (38) |
113 (45) |
110 (43) |
113 (45) |
104 (40) |
92 (33) |
76 (24) |
66 (19) |
113 (45) |
| Mean daily maximum °F (°C) | 38.8 (3.8) |
44.8 (7.1) |
53.7 (12.1) |
61.9 (16.6) |
71.5 (21.9) |
79.4 (26.3) |
90.0 (32.2) |
88.8 (31.6) |
78.5 (25.8) |
62.7 (17.1) |
47.3 (8.5) |
37.9 (3.3) |
62.9 (17.2) |
| Daily mean °F (°C) | 32.3 (0.2) |
35.8 (2.1) |
42.3 (5.7) |
48.7 (9.3) |
56.7 (13.7) |
63.6 (17.6) |
71.3 (21.8) |
70.3 (21.3) |
61.2 (16.2) |
49.3 (9.6) |
38.6 (3.7) |
31.2 (−0.4) |
50.1 (10.1) |
| Mean daily minimum °F (°C) | 25.8 (−3.4) |
26.9 (−2.8) |
30.8 (−0.7) |
35.5 (1.9) |
41.9 (5.5) |
47.7 (8.7) |
52.5 (11.4) |
51.8 (11.0) |
44.0 (6.7) |
35.8 (2.1) |
29.8 (−1.2) |
24.5 (−4.2) |
37.3 (2.9) |
| Record low °F (°C) | −30 (−34) |
−24 (−31) |
−6 (−21) |
8 (−13) |
19 (−7) |
26 (−3) |
30 (−1) |
28 (−2) |
15 (−9) |
3 (−16) |
−17 (−27) |
−34 (−37) |
−34 (−37) |
| Average precipitation inches (mm) | 1.96 (50) |
1.34 (34) |
1.66 (42) |
1.30 (33) |
1.26 (32) |
0.96 (24) |
0.31 (7.9) |
0.32 (8.1) |
0.50 (13) |
1.12 (28) |
1.96 (50) |
2.37 (60) |
15.06 (383) |
| Average snowfall inches (cm) | 4.1 (10) |
2.2 (5.6) |
0.8 (2.0) |
0.1 (0.25) |
0.0 (0.0) |
0.0 (0.0) |
0.0 (0.0) |
0.0 (0.0) |
0.0 (0.0) |
0.0 (0.0) |
1.8 (4.6) |
8.1 (21) |
17.1 (43) |
| Average precipitation days (≥ 0.01 in) | 14.0 | 11.4 | 11.9 | 9.1 | 7.9 | 6.3 | 2.9 | 2.7 | 3.6 | 8.3 | 13.2 | 14.6 | 105.9 |
| Average snowy days (≥ 0.1 in) | 4.4 | 1.7 | 1.1 | 0.2 | 0.0 | 0.0 | 0.0 | 0.0 | 0.0 | 0.1 | 1.2 | 5.3 | 14.0 |
| Source: NOAA[8][9] | |||||||||||||
Demographics[edit]
| Census | Pop. | Note | %± |
|---|---|---|---|
| 1930 | 471 | — | |
| 1940 | 475 | 0.8% | |
| 1950 | 457 | −3.8% | |
| 1960 | 463 | 1.3% | |
| 1970 | 426 | −8.0% | |
| 1980 | 373 | −12.4% | |
| 1990 | 336 | −9.9% | |
| 2000 | 380 | 13.1% | |
| 2010 | 313 | −17.6% | |
| 2020 | 297 | −5.1% | |
| 2022 (est.) | 294 | [4] | −1.0% |
| U.S. Decennial Census[10] 2020 Census[3] | |||
2010 census[edit]
As of the 2010 census, there were 313 people, 153 households, and 96 families residing in the town. The population density was 401.3 inhabitants per square mile (154.9/km2). There were 181 housing units at an average density of 232.1 per square mile (89.6/km2). The racial makeup of the town was 95.8% White, 0.3% African American, 0.6% Native American, 0.3% Asian, 0.3% from other races, and 2.6% from two or more races. Hispanic or Latino of any race were 0.3% of the population.
There were 153 households, of which 19.6% had children under the age of 18 living with them, 52.9% were married couples living together, 5.2% had a female householder with no husband present, 4.6% had a male householder with no wife present, and 37.3% were non-families. 33.3% of all households were made up of individuals, and 22.9% had someone living alone who was 65 years of age or older. The average household size was 2.05 and the average family size was 2.53.
The median age in the town was 51.8 years. 15.7% of residents were under the age of 18; 5.4% were between the ages of 18 and 24; 14.8% were from 25 to 44; 34.2% were from 45 to 64; and 30% were 65 years of age or older. The gender makeup of the town was 50.2% male and 49.8% female.
2000 census[edit]
As of the 2000 census, there were 380 people, 164 households, and 105 families residing in the town. The population density was 1,101.6 people per square mile (431.5/km2). There were 187 housing units at an average density of 542.1 per square mile (212.4/km2). The racial makeup of the town was 93.42% White, 3.16% Native American, 0.26% Asian, 0.53% from other races, and 2.63% from two or more races. Hispanic or Latino of any race were 0.53% of the population.
There were 164 households, out of which 31.1% had children under the age of 18 living with them, 54.3% were married couples living together, 9.1% had a female householder with no husband present, and 35.4% were non-families. 32.9% of all households were made up of individuals, and 19.5% had someone living alone who was 65 years of age or older. The average household size was 2.32 and the average family size was 2.90.
In the town, the age distribution of the population shows 28.2% under the age of 18, 1.6% from 18 to 24, 26.6% from 25 to 44, 21.1% from 45 to 64, and 22.6% who were 65 years of age or older. The median age was 42 years. For every 100 females, there were 99.0 males. For every 100 females age 18 and over, there were 88.3 males.
The median income for a household in the town was $30,893, and the median income for a family was $40,833. Males had a median income of $30,972 versus $20,313 for females. The per capita income for the town was $16,656. About 2.1% of families and 5.9% of the population were below the poverty line, including 4.5% of those under age 18 and 6.0% of those age 65 or over.
Notable groups and events[edit]
The La Crosse Arts and Beautification Council was created in 2005 with aspirations of renovating downtown La Crosse while promoting the arts, local culture, and history of La Crosse and the Palouse. Events have included the Valentine Fine Arts Night and the Spring Faire.
The La Crosse Gun Club holds an annual "Bacon & Crab Shooting" event at the end of January.
The La Crosse Farmers Festival, held in mid-June, is celebrated with a parade and live entertainment. This has not been held for several years, and it is not known why.
References[edit]
- ^ "2020 U.S. Gazetteer Files". United States Census Bureau. Retrieved July 24, 2022.
- ^ a b U.S. Geological Survey Geographic Names Information System: La Crosse, Washington
- ^ a b c "Explore Census Data". United States Census Bureau. Retrieved January 8, 2024.
- ^ a b "City and Town Population Totals: 2020-2022". United States Census Bureau. January 8, 2024. Retrieved January 8, 2024.
- ^ "LaCrosse (WA) sales tax rate". Retrieved January 8, 2024.
- ^ "US Gazetteer files: 2010, 2000, and 1990". United States Census Bureau. February 12, 2011. Retrieved April 23, 2011.
- ^ "US Gazetteer files 2010". United States Census Bureau. Archived from the original on January 25, 2012. Retrieved December 19, 2012.
- ^ "NOWData - NOAA Online Weather Data". National Oceanic and Atmospheric Administration. Retrieved December 12, 2023.
- ^ "Summary of Monthly Normals 1991-2020". National Oceanic and Atmospheric Administration. Retrieved December 12, 2023.
- ^ United States Census Bureau. "Census of Population and Housing". Retrieved September 24, 2014.
External links[edit]
Municipalities and communities of Whitman County, Washington, United States | ||
|---|---|---|
| Cities | 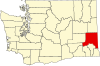 | |
| Towns | ||
| CDP | ||
| Other communities | ||
| Ghost towns | ||