
Potter County, South Dakota
Potter County | |
|---|---|
 Potter County Courthouse (July 2013) | |
 Location within the U.S. state of South Dakota | |
 South Dakota's location within the U.S. | |
| Coordinates: 45°04′N 99°57′W / 45.06°N 99.95°W | |
| Country | |
| State | |
| Founded | 1873 (created) 1883 (organized) |
| Named for | Joel A. Potter |
| Seat | Gettysburg |
| Largest city | Gettysburg |
| Area | |
| • Total | 899 sq mi (2,330 km2) |
| • Land | 861 sq mi (2,230 km2) |
| • Water | 38 sq mi (100 km2) 4.2% |
| Population (2020) | |
| • Total | 2,472 |
| • Estimate (2023) | 2,413 |
| • Density | 2.7/sq mi (1.1/km2) |
| Time zone | UTC−6 (Central) |
| • Summer (DST) | UTC−5 (CDT) |
| Congressional district | At-large |
Potter County is a county in the U.S. state of South Dakota. As of the 2020 census, the population was 2,472.[1] Its county seat is Gettysburg.[2] The county was created in 1873 and organized in 1883.[3]
Geography[edit]
The Missouri River flows southward along the west boundary line of Potter County. The county terrain consists of rolling hills, mostly devoted to agriculture.[4] The county generally slopes to the south, although the western portion slopes into the river valley.[5] The county has a total area of 899 square miles (2,330 km2), of which 861 square miles (2,230 km2) is land and 38 square miles (98 km2) (4.2%) is water.[6]
The eastern portion of South Dakota's counties (48 of 66) observe Central Time; the western counties (18 of 66) observe Mountain Time. Potter County is the westernmost of the SD counties to observe Central Time.[7]
Major highways[edit]
Adjacent counties[edit]
- Walworth County - north
- Edmunds County - northeast
- Faulk County - east
- Hyde County - southeast
- Sully County - south
- Dewey County - west (observes Mountain Time)
Protected areas[4][edit]
- Dodge Draw State Game Production Area
- Dodge Draw State Lakeside Use Area
- East Whitlock State Lakeside Use Area
- Forest City State Game Production Area
- Green Lake State Game Production Area
- Potts Dam State Game Production Area
- Siebrasse State Game Production Area
- West Whitlock State Recreation Area
- Whitlocks Bay State Game Production Area
Lakes[4][edit]
- Green Lake
- Lake Hurley
- Lake Oahe (part)
Demographics[edit]
| Census | Pop. | Note | %± |
|---|---|---|---|
| 1890 | 2,910 | — | |
| 1900 | 2,988 | 2.7% | |
| 1910 | 4,466 | 49.5% | |
| 1920 | 4,382 | −1.9% | |
| 1930 | 5,762 | 31.5% | |
| 1940 | 4,614 | −19.9% | |
| 1950 | 4,688 | 1.6% | |
| 1960 | 4,926 | 5.1% | |
| 1970 | 4,449 | −9.7% | |
| 1980 | 3,674 | −17.4% | |
| 1990 | 3,190 | −13.2% | |
| 2000 | 2,693 | −15.6% | |
| 2010 | 2,329 | −13.5% | |
| 2020 | 2,472 | 6.1% | |
| 2023 (est.) | 2,413 | [8] | −2.4% |
| U.S. Decennial Census[9] 1790-1960[10] 1900-1990[11] 1990-2000[12] 2010-2020[1] | |||
2020 census[edit]
As of the 2020 census, there were 2,472 people, 1,127 households, and 753 families residing in the county.[13] The population density was 2.9 inhabitants per square mile (1.1/km2). There were 1,569 housing units.
2010 census[edit]
As of the 2010 census, there were 2,329 people, 1,062 households, and 648 families in the county. The population density was 2.7 inhabitants per square mile (1.0/km2). There were 1,500 housing units at an average density of 1.7 units per square mile (0.66 units/km2). The racial makeup of the county was 97.6% white, 0.9% American Indian, 0.3% Asian, 0.1% black or African American, 0.2% from other races, and 0.9% from two or more races. Those of Hispanic or Latino origin made up 0.7% of the population. In terms of ancestry, 65.3% were German, 11.1% were Irish, 8.2% were Norwegian, 8.0% were English, and 3.9% were American.
Of the 1,062 households, 21.7% had children under the age of 18 living with them, 53.0% were married couples living together, 4.2% had a female householder with no husband present, 39.0% were non-families, and 35.5% of all households were made up of individuals. The average household size was 2.13 and the average family size was 2.76. The median age was 50.6 years.
The median income for a household in the county was $42,422 and the median income for a family was $53,214. Males had a median income of $33,750 versus $29,792 for females. The per capita income for the county was $23,986. About 5.4% of families and 10.0% of the population were below the poverty line, including 11.7% of those under age 18 and 10.8% of those age 65 or over.
Communities[edit]
City[edit]
- Gettysburg (county seat)
Towns[edit]
Unincorporated area[4][edit]
- Forest City
Townships[edit]
The county has no organized townships. It is divided into three areas of unorganized territory: West Potter, Central Potter, and East Potter.
Politics[edit]
Like most of South Dakota outside of Native American counties, Potter County has been predominantly Republican throughout most of the state's history. Only three Democrats – William Jennings Bryan, Franklin D. Roosevelt and Lyndon Johnson – have carried the county as of 2020, and since Jimmy Carter in 1976 no Democrat has passed forty percent of the county's vote.
| Year | Republican | Democratic | Third party | |||
|---|---|---|---|---|---|---|
| No. | % | No. | % | No. | % | |
| 2020 | 1,139 | 82.54% | 227 | 16.45% | 14 | 1.01% |
| 2016 | 1,071 | 80.10% | 215 | 16.08% | 51 | 3.81% |
| 2012 | 1,029 | 74.51% | 339 | 24.55% | 13 | 0.94% |
| 2008 | 937 | 65.07% | 482 | 33.47% | 21 | 1.46% |
| 2004 | 1,143 | 70.64% | 463 | 28.62% | 12 | 0.74% |
| 2000 | 1,112 | 74.43% | 356 | 23.83% | 26 | 1.74% |
| 1996 | 979 | 57.52% | 534 | 31.37% | 189 | 11.10% |
| 1992 | 901 | 50.67% | 493 | 27.73% | 384 | 21.60% |
| 1988 | 1,175 | 62.07% | 701 | 37.03% | 17 | 0.90% |
| 1984 | 1,551 | 76.22% | 482 | 23.69% | 2 | 0.10% |
| 1980 | 1,633 | 75.29% | 436 | 20.10% | 100 | 4.61% |
| 1976 | 1,136 | 55.36% | 908 | 44.25% | 8 | 0.39% |
| 1972 | 1,389 | 61.65% | 858 | 38.08% | 6 | 0.27% |
| 1968 | 1,273 | 57.81% | 780 | 35.42% | 149 | 6.77% |
| 1964 | 954 | 43.09% | 1,260 | 56.91% | 0 | 0.00% |
| 1960 | 1,326 | 56.91% | 1,004 | 43.09% | 0 | 0.00% |
| 1956 | 1,445 | 63.16% | 843 | 36.84% | 0 | 0.00% |
| 1952 | 1,625 | 73.73% | 579 | 26.27% | 0 | 0.00% |
| 1948 | 1,044 | 49.69% | 1,039 | 49.45% | 18 | 0.86% |
| 1944 | 1,001 | 58.27% | 717 | 41.73% | 0 | 0.00% |
| 1940 | 1,278 | 54.80% | 1,054 | 45.20% | 0 | 0.00% |
| 1936 | 914 | 39.64% | 1,338 | 58.02% | 54 | 2.34% |
| 1932 | 660 | 28.09% | 1,668 | 70.98% | 22 | 0.94% |
| 1928 | 1,240 | 52.77% | 1,100 | 46.81% | 10 | 0.43% |
| 1924 | 1,075 | 59.82% | 283 | 15.75% | 439 | 24.43% |
| 1920 | 1,073 | 72.30% | 255 | 17.18% | 156 | 10.51% |
| 1916 | 512 | 54.58% | 408 | 43.50% | 18 | 1.92% |
| 1912 | 0 | 0.00% | 423 | 46.95% | 478 | 53.05% |
| 1908 | 614 | 58.09% | 400 | 37.84% | 43 | 4.07% |
| 1904 | 525 | 62.80% | 275 | 32.89% | 36 | 4.31% |
| 1900 | 375 | 47.95% | 381 | 48.72% | 26 | 3.32% |
| 1896 | 333 | 45.74% | 390 | 53.57% | 5 | 0.69% |
| 1892 | 320 | 51.12% | 57 | 9.11% | 249 | 39.78% |
See also[edit]
45°04′N 99°57′W / 45.06°N 99.95°W
References[edit]
- ^ a b "State & County QuickFacts". United States Census Bureau. Retrieved March 21, 2024.
- ^ "Find a County". National Association of Counties. Retrieved June 7, 2011.
- ^ "Dakota Territory, South Dakota, and North Dakota: Individual County Chronologies". Dakota Territory Atlas of Historical County Boundaries. The Newberry Library. 2006. Archived from the original on April 2, 2018. Retrieved March 31, 2015.
- ^ a b c d Potter County SD Google Maps (accessed February 8, 2019)
- ^ ""Find an Altitude" Google Maps (accessed February 8, 2019)". Archived from the original on May 21, 2019. Retrieved February 8, 2019.
- ^ "2010 Census Gazetteer Files". United States Census Bureau. August 22, 2012. Retrieved March 28, 2015.
- ^ Map of Time Zone Line through South Dakota (accessed January 30, 2019)
- ^ "County Population Totals and Components of Change: 2020-2023". Retrieved March 17, 2024.
- ^ "U.S. Decennial Census". United States Census Bureau. Retrieved March 28, 2015.
- ^ "Historical Census Browser". University of Virginia Library. Retrieved March 28, 2015.
- ^ Forstall, Richard L., ed. (March 27, 1995). "Population of Counties by Decennial Census: 1900 to 1990". United States Census Bureau. Retrieved March 28, 2015.
- ^ "Census 2000 PHC-T-4. Ranking Tables for Counties: 1990 and 2000" (PDF). United States Census Bureau. April 2, 2001. Archived (PDF) from the original on October 9, 2022. Retrieved March 28, 2015.
- ^ "US Census Bureau, Table P16: Household Type". United States Census Bureau. Retrieved March 21, 2024.
- ^ Leip, David. "Atlas of US Presidential Elections". uselectionatlas.org. Retrieved April 15, 2018.
Places adjacent to Potter County, South Dakota | ||||||||||||||||
|---|---|---|---|---|---|---|---|---|---|---|---|---|---|---|---|---|
| ||||||||||||||||
Municipalities and communities of Potter County, South Dakota, United States | ||
|---|---|---|
| Cities | 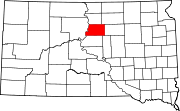 | |
| Towns | ||
| Unincorporated communities | ||
| Ghost town | ||
| International | |
|---|---|
| National | |